
TL ; DR 📖
Macro
• Inflation cooled more than expected
• Labor market softened without sharp stress
• Rates held near 6.25%
Central Ohio
• Inventory still sharply higher YoY
• Showings remain weak due to the holidays
• Pricing holding but with more reductions
The RealTea 🫖
Nationally, disinflation and a cooling labor market are easing pressure on rates. Locally, rising inventory is improving buyer leverage, even as demand stays muted.
Tailwinds
• CPI and core inflation trending lower
• Mortgage rates stable near recent lows
• Inventory growth improving buyer choice
Headwinds
• Affordability still tight for first-time buyers
• Slower job growth could limit demand
• Elevated price reductions signal caution
Spotlight: November Jobs Report 🔦
November employment data showed a softening but stable labor market. Payrolls rose by 64,000 after a revised October loss of 105,000 jobs. The unemployment rate increased to 4.6%, the highest since late 2021. Hiring concentrated in health care and construction, while government employment declined. Real wages rose 0.8% YoY as inflation eased, though monthly wage growth slowed. Overall momentum points to cooling, not collapse.
Highlights
• Payroll growth: +64,000
• Unemployment rate: 4.6%
• Real wage growth: ⬆️ 0.8% YoY
• Job gains concentrated in a few sectors
Takeaway: A cooling labor market reduces inflation pressure without signaling recession risk yet.
Spotlight: The Latest CPI Data 🔦
The November CPI report showed inflation cooling faster than expected. Headline CPI slowed to 2.7% YoY, below the 3.1% estimate and down from 3.0% in September. Core CPI eased to 2.6%, the lowest level since early 2021. Shelter inflation continued to slow at 3.0%, a key improvement for housing costs. The report reflected a two-month window due to the government shutdown, which slightly distorts seasonality, but even with that caveat, the disinflation trend remains intact.
Highlights
• Headline CPI: 2.7% YoY
• Core CPI: 2.6%, lowest since 2021
• Shelter inflation: 3.0% YoY
• Two-month data window due to shutdown
Takeaway: Cooling inflation strengthens the case for rate stability now and cuts later in 2026.
Macro Update 📊
Last week reinforced a slow disinflation narrative. A cool CPI report caught everyone off guard, labor data softened, and rates stayed stable. Markets read the data as supportive for eventual Fed easing in 2026.
Stock Market Performance Last Week
Markets were mixed as inflation data offset labor concerns.
• Dow Jones: ⬇️ 0.67% WoW
• S&P 500: ⬇️ 0.25% WoW
• Nasdaq: ⬆️ 0.49% WoW
10-Year Treasury Bond Performance Last Week
10-Year US Treasury Yield: December 15–19, 2025
• Weekly range: 4.108% to 4.198%
• Ended week at 4.151%, down 3.1 bps
30-Yr Mortgage Rates (Mortgage News Daily)
• Dec 15 → Dec 16 → Dec 17 → Dec 18 → Dec 19
• 6.29% → 6.27% → 6.27% → 6.22% → 6.25%
• Weekly average: 6.26%


Mortgage Applications
Mortgage Purchase Applications (Last 4 Weeks)
181.6 → 186.1 → 181.6 → 176.5
Same period last year:
152.9 → 161.5 → 154.9 → 157.1
⬇️ 2.8% WoW
⬆️ 12.3% YoY

Federal Reserve (CME FedWatch)
Current target range: 3.50–3.75%
Jan 28, 2026 meeting odds:
• No cut: 79%
• 25 bps cut: 21%
Interpretation: Markets still expect patience near term, with easing bias (new Fed leadership) later in 2026.

Other Indicators
Fear & Greed Index: 45 Neutral

Truflation Inflation Index: 2.39%

Sentiment on X (Last 7 Days) 📢
National
• Inventory growth and flat prices are shifting sentiment toward buyers, but affordability remains the dominant constraint.
• Rate dips near 6.25% sparked cautious optimism, though most buyers still feel priced out.
Columbus
• Social chatter is more constructive than nationally, with inventory growth and buyer leverage driving optimism.
• Columbus is increasingly framed as a 2026 buyer opportunity due to relative affordability and supply growth.
Pull Quote
“Rates are helping, inventory is growing, but affordability still decides who can actually buy.”
Central Ohio Market Update 🌎📍
Market Dynamics: A Seller’s Market shifting toward Buyer-friendly conditions.
Central Ohio continues to transition toward a more balanced market. Inventory growth is reshaping negotiations, while pricing remains stable due to constrained demand rather than oversupply.
Stats From the Last 4 Weeks
Closings: 1,916 ⬇️ 7.1% YoY
New Listings: 1,409 ⬆️ 9.5% YoY
Active Inventory: 4,282 ⬆️ 54.8% YoY
Median Price: $330,000 ⬆️ 1.5% YoY
Avg DOM: 40 ⬆️ 21.2% YoY
Months of Supply: 2.3
Year-to-Date Snapshot
Closings: 27,904 ⬆️ 0.7% YoY
Median Price: $337,450 ⬆️ 3.4% YoY
Avg $/SF: $212.44 ⬆️ 2.7% YoY
New Listings: 30,538 ⬆️ 7.5% YoY


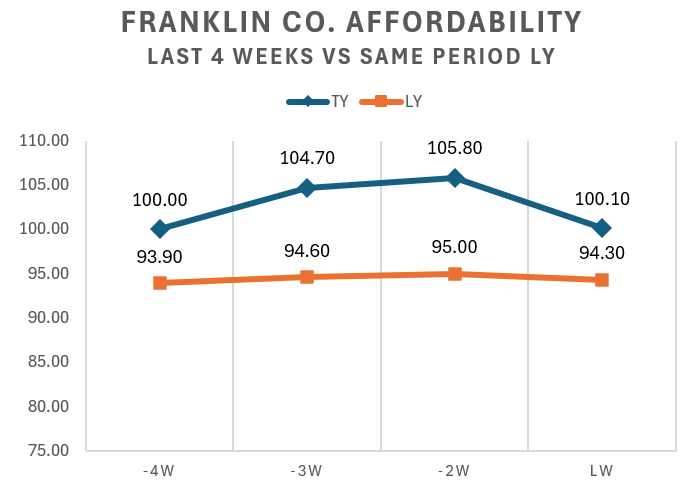
Showings & Affordability
Question: Where would rates need to be for Franklin County to have an Affordability Index of 100? 🤔
Answer: Assuming a median home price of $340,000 & a median income of $76,536, mortgage rates would need to be at 5.80% to achieve an Affordability Index of 100 - ie, a family with the median income can afford the mortgage payment on a median-priced home. The average weekly Affordability Index for 2025 in Franklin Co. is 98.4. As of July 2025, the National Affordability Index is 98.8 (Source: National Association of Realtors via FRED®).
Franklin County Affordability Index, Last 4 Weeks:
100.0 → 104.7 → 105.8 → 100.1
Same Period 2024:
93.9 → 94.6 → 95.0 → 94.3
⬇️ 5.4% WoW
⬆️ 6.0% YoY

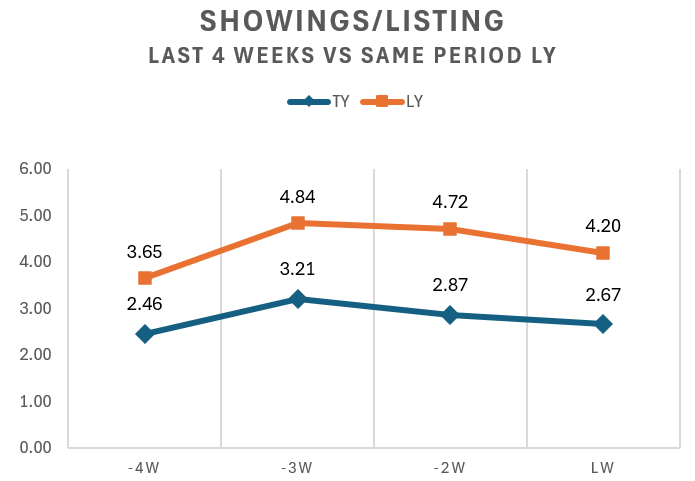
Showings per Listing (last 4 weeks):
2.5 → 3.2 → 2.9 → 2.7
Same Period 2024:
3.7 → 4.8 → 4.7 → 4.2
⬇️ 6.8% WoW
⬇️ 36.4% YoY

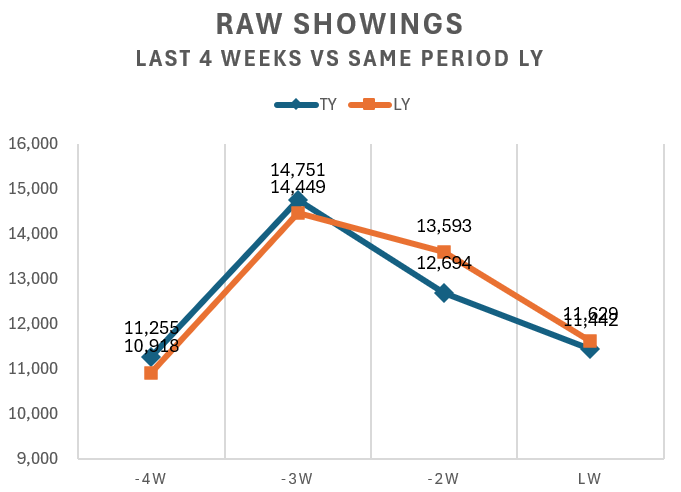
Raw Showings Last 4 Weeks:
11,255 → 14,751 → 12,694 → 11,442
Same Period 2024:
10,918 → 14,449 → 13,593 → 11,629
⬇️ 9.9% WoW
⬇️ 1.6% YoY

Here’s the data:
Disclaimer: The information shared in this newsletter is for educational and informational purposes only and should not be considered legal, financial, or investment advice. Always consult with a qualified attorney, financial advisor, or other professional regarding your specific situation.
—
All data pulled from Columbus REALTORS® Multiple Listing Service (MLS). Central OH is defined as Single-Family, Residential listings from the following Counties - Franklin, Delaware, Licking, Fairfield, Union, Pickaway, Madison, Morrow, Fayette, Athens, Champaign, Clark, Clinton, Hocking, Knox, Logan, Marion, Muskingum, Perry, Ross. Sales figures do not account for seller concessions/credits provided to buyers. Price reductions are defined as a reduction taken at any time during the lifespan of the listing.