It’s Fed WEEK! If the Fed cuts, what will happen to rates? 🤔
With the Fed widely expected to cut rates by 25 bps this week, the key question is whether mortgage rates will fall further, stay steady, or even push back up. Here are the scenarios, along with what experts are projecting.
Baseline Case – Rates Hold Steady or Ease Slightly
Mortgage rates have already drifted lower in recent weeks as markets priced in a cut and weaker jobs data.
A 25 bps move is widely expected, so much of the impact may already be reflected in Treasury yields and mortgage rates.
Outcome: 30-yr fixed hovers in the mid-6% range, perhaps easing slightly.
Optimistic Case – Rates Fall More Sharply
If investors see more cuts ahead or inflation cools faster, demand for Treasuries and MBS could drive yields down further.
A softening labor market or global uncertainty could accelerate the “flight to safety.”
Outcome: Mortgage rates dip closer to 6.0%–6.2%
Pessimistic Case – Rates Push Higher
If inflation runs hot, or if markets doubt the Fed’s willingness to keep cutting, yields could rise.
Large Treasury issuance or widening MBS spreads could also pressure mortgage rates upward.
Outcome: Rates flatten out or tick back toward the upper-6% range
What the Experts Are Saying
NerdWallet – Rates may stay mostly unchanged, with only a slight drop after the cut.
Fannie Mae – Projects 30-yr fixed around 6.5% by year-end.
The Mortgage Reports – Expect stabilization in the mid-to-upper-6% range.
Forbes / Banks – See mortgage rates holding in the 6.3%–6.7% range through year-end.
Norada Real Estate – Slight drop possible, with 30-yr fixed in 6.2%–6.5% this fall.
Consensus: Most forecasters call for mortgage rates to stay anchored in the mid-6% range, with only modest drops likely.

Spotlight: CPI, Jobs Revision, and Fed Decision 🔦
The August CPI report and a major jobs revision combined to all but guarantee a Federal Reserve rate cut at the September FOMC meeting. Headline inflation rose 0.4% in August and 2.9% YoY, its fastest annual pace since January, raising fresh concerns about price persistence. However, core CPI held steady at 0.3% MoM, reinforcing that underlying inflationary pressure could be leveling off.
The bigger story came from the labor market. The Bureau of Labor Statistics announced a preliminary revision that lowered job creation by 911,000 for the 12 months ending in March 2025, one of the largest downward adjustments on record. Combined with a recent rise in jobless claims, this confirmed that the labor market is far weaker than previously reported.
For the Fed, its hand is being forced: inflation is still elevated, but labor weakness has become too large to ignore. Markets now see a 96% chance of a 25 bps cut this week. The bigger question is whether this cut will be the start of a gradual easing cycle or a one-off adjustment to steady the economy.
Spotlight: The Dangers of Cutting Into Inflation 🔦
While markets are eager for lower borrowing costs, history shows the risks of easing policy while inflation is still elevated. Cutting interest rates too soon can undo progress on price stability and set the stage for renewed inflation.
Key Risks:
Fueling Inflation: Cheaper credit encourages households and businesses to borrow and spend more. If demand grows faster than supply, prices can accelerate again.
Economic Instability: The U.S. has faced “double-dip” inflation before, most notably in the 1970s, when early rate cuts reignited inflation and forced much more painful tightening later.
Dollar Pressure: Lower rates reduce demand for U.S. assets, potentially weakening the dollar. While this benefits exporters, it also raises the cost of imports, feeding inflation further.
Fed Credibility: By easing into a hot inflation backdrop, the Fed risks undermining confidence in its commitment to price stability, which could increase long-term inflation expectations.
The dilemma is that the Fed must balance its dual mandate. With the labor market clearly weakening, policymakers may prioritize employment support, even at the risk of letting inflation run hotter in the short term. The challenge will be whether the Fed can thread the needle without sacrificing its credibility or sparking another wave of inflation.
The RealTea 🫖
The past week reinforced expectations of a September Fed rate cut, as weak labor data and a large jobs revision outweighed a hotter headline CPI. Markets responded positively, with stocks hitting new highs and mortgage rates holding steady near one-year lows. Locally, Central Ohio remains active, with more listings and sales activity, but affordability continues to pinch buyers.
Tailwinds:
Mortgage rates held steady near one-year lows, improving affordability.
Strong rebound in purchase applications (+22% YoY) signals buyer demand is still there.
Equity markets surged, with S&P and Nasdaq hitting new record highs.
Headwinds:
CPI came in hotter on the headline side, raising concerns about inflation persistence.
BLS revision showed 911,000 fewer jobs than previously reported, confirming labor market weakness.
Central Ohio affordability remains stretched despite stable rates, with showings per listing still down sharply YoY.
TL ; DR 📖
Macro:
📉 Headline CPI ticked up but labor softness cemented a Fed cut for Sept.
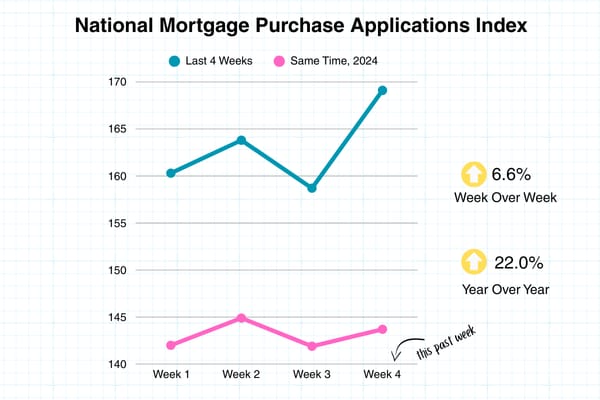
📈 Mortgage apps surged +6.6% WoW, +22% YoY.
📊 Stocks at record highs, 10-year yields hovering near 4.0%.
Central OH:
🏠 Active inventory ⬆️ 67.2% YoY, slight ⬇️ WoW.
💲 Median price $343K ⬆️ 3.9% YoY.
📉 Showings per listing ⬇️ 36.8% YoY.
Macro Update 📊
Stock Market Performance Last Week
Nasdaq: +2.0% (record high)
S&P 500: +1.6% (record high)
Dow Jones: -0.3% (2nd weekly decline)
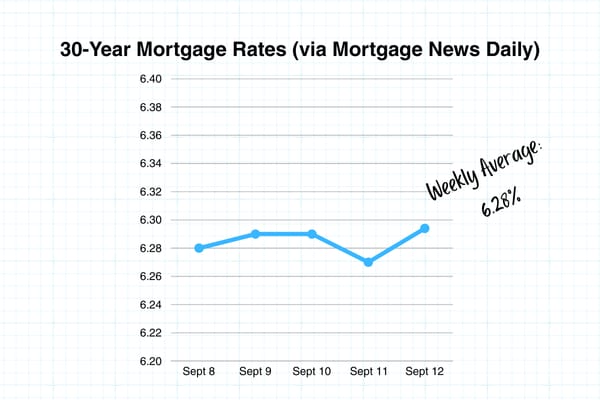
30-Yr Mortgage Rates (Mortgage News Daily)
Sep 8 → Sep 9 → Sep 10 → Sep 11 → Sep 12
6.28% → 6.29% → 6.29% → 6.27% → 6.29%
Weekly Avg: 6.28%

Mortgage Applications
Last 4 weeks:
160.3 → 163.8 → 158.7 → 169.1
Same period 2024:
142.0 → 144.9 → 141.9 → 143.7
⬆️ 6.6% WoW
⬆️ 22% YoY

Federal Reserve (CME FedWatch)
Sept 17 Meeting:
96.4% odds of 25 bps cut.
Oct 29 Meeting:
81% odds of another 25 bps cut.
Other Indicators
Fear & Greed Index: 54 (Neutral)
shared.image.missing_image
Truflation Inflation Index: 2.17%
Sentiment on X (Last 7 Days) 📢
Nationwide: Buyers see a cooling market with more inventory (+30% YoY) and leverage shifting their way, but affordability remains “brutal.” Rates at ~6.3% are better but still seen as restrictive. Rent looks more attractive to many younger buyers.
Columbus: Similar sentiment, with affordability strain and longer selling times. Local positives include data center growth and Groveport housing plans, but not enough to offset affordability headwinds.
Pull-Quote: “Housing costs won’t return to normal anytime soon, with buyers waiting for relief that still feels out of reach.”
Central Ohio Market Update 🌎📍
Market Dynamics: A Seller’s Market shifting toward Buyer-friendly conditions.
Central Ohio continues to mirror national trends: more listings, more price reductions, and higher days on market. With sales prices still rising modestly, affordability pressure remains a major concern.
Stats From the Last 4 Weeks (Aug wk 3 – Sep wk 2)
Closings: 2,337 ⬇️ 0.7% YoY
New Listings: 2,894 ⬆️ 19.6% YoY
Active Inventory: 5,361 ⬆️ 67.2% YoY ⬇️ 1.2% WoW
Median Price: $343,000 ⬆️ 3.9% YoY
DOM: 29 ⬆️ 31.8% YoY
Months of Supply: 2.3
Year-to-Date (YTD) Snapshot │ Through 09/14
Closings: 19,880 ⬇️ 1.1% YoY
Median Sales Price: $339,000 ⬆️ 3.8% YoY
Avg $/SF: $213.33 ⬆️ 2.9% YoY
% of List Price Received: 98.3% ⬇️ 0.3% YoY
New Listings: 24,759 ⬆️ 13.3% YoY
Showings & Affordability
Question: Where would rates need to be for Franklin County to have an Affordability Index of 100? 🤔
Answer: Assuming a median home price of $340,000 & a median income of $71,680, mortgage rates would need to be at 5.20% to achieve an Affordability Index of 100 - ie, a family with the median income can afford the mortgage payment on a median-priced home. The average weekly Affordability Index for 2025 in Franklin Co. is 91.0. As of June 2025, the National Affordability Index is 94.4 (Source: National Association of Realtors via FRED®).
Franklin County Affordability Index, Last 4 Weeks:
90.2 → 84.9 → 91.7 → 100.5 (median price was $300k LW)
Last week’s affordability index for Franklin County came in at 100.5, with the main drivers being lower rates and a weekly median sale price in Franklin Co. at just over $300k. Using median sales data from the last 4 weeks, affordability is hovering around 88.8 based on current rates.
Same Period 2024:
95.6 → 91.2 → 97.3 → 94.2

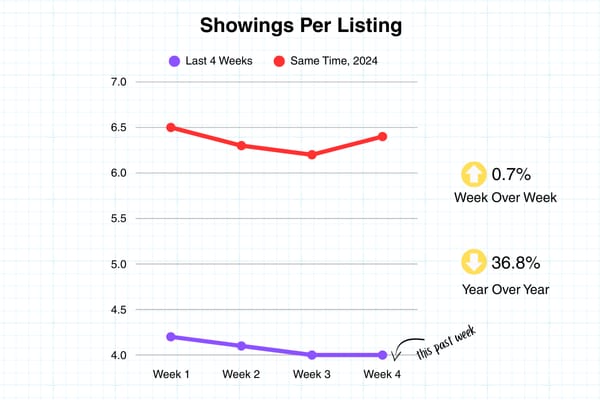
Showings per Listing, Last 4 Weeks:
4.2 → 4.1 → 4.0 → 4.0
Same Period 2024:
6.5 → 6.3 → 6.2 → 6.4
WoW: ⬆️ 0.7%
YoY: ⬇️ 36.8%

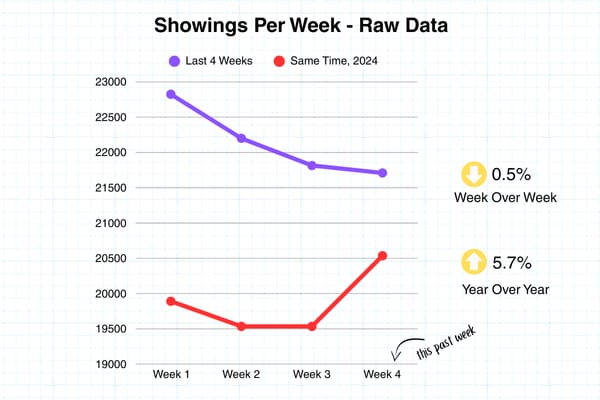
Raw Showings Data, Last 4 Weeks:
22,825 → 22,200 → 21,815 → 21,710
Same Period 2024:
19,891 → 19,535 → 19,535 → 20,536
WoW: ⬇️ 0.5%
YoY: ⬆️ 5.7%


Here’s the data:
All data pulled from Columbus REALTORS® Multiple Listing Service (MLS). Central OH is defined as Single-Family, Residential listings from the following Counties - Franklin, Delaware, Licking, Fairfield, Union, Pickaway, Madison, Morrow, Fayette, Athens, Champaign, Clark, Clinton, Hocking, Knox, Logan, Marion, Muskingum, Perry, Ross. Sales figures do not account for seller concessions/credits provided to buyers. Price reductions are defined as a reduction taken at any time during the lifespan of the listing.


