Spotlight: Mortgage Rates Plummet Back to Fall 2024 Levels 🔦
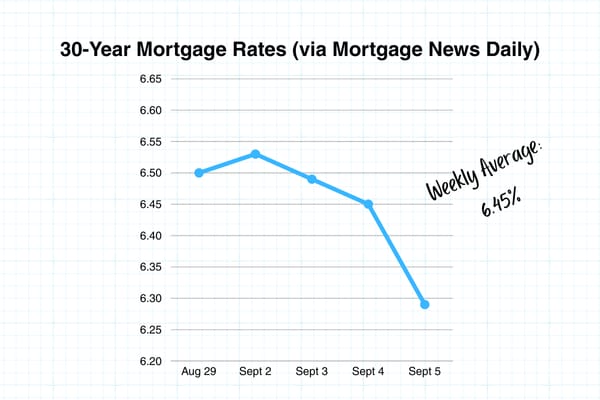
On Friday, September 5th, mortgage rates fell to 6.29%, their lowest since Fall 2024. The drop came on the heels of a weak August jobs report, which showed just +22K new jobs (vs. 75K expected), along with downward revisions to June payrolls, and unemployment rising to 4.3%. The soft labor data triggered a “flight to safety” into bonds, pushing bond prices up and yields down. Since mortgage rates closely follow long-term Treasury yields, rates also dropped sharply.
Why it matters:
Largest single-day mortgage rate drop in 11 months.
Confirms market expectations of a Fed rate cut at the September 17th meeting.
Offers short-term affordability relief, especially for buyers waiting on rate movement.
Highlights the strong link between jobs data, bond yields, and mortgage rates - all items we are watching very closely.
Inflation is still above the Fed’s 2% target, which could limit how far rates fall even if cuts occur.
Takeaway: The jobs market now rivals inflation as the key driver for Fed policy. If labor data continues to soften, more cuts and lower rates are likely, but the ceiling for affordability gains and additional rate cuts will be influenced by inflation data, as the Fed works toward a balance between supporting strong labor and controlling inflation.
Spotlight: Fed Rate Cut Odds Jump After Weak Jobs Data 🔦
With last week’s jobs #’s and unemployment rising to 4.3%, markets now view a Fed rate cut in September as virtually guaranteed.
Current CME FedWatch probabilities:
September 17 Meeting:
92% chance of a 25 bps cut
8% chance of a 50 bps cut
0% odds of no cut
October 29 Meeting (assuming 25 bps in Sept):
72.6% chance of another 25 bps cut
6.2% chance of a 50 bps cut
21.2% chance of no further move
Why it matters:
The odds of no action in September have been completely eliminated.
Markets are now starting to price in the possibility of a more aggressive 50 bps cut.
The Fed is shifting focus from inflation toward employment weakness, signaling that labor market data will be the key driver of policy decisions this fall.
The RealTea 🫖
Last week highlighted the fine line the Fed is walking as they work to support strong labor markets while managing inflation. Nationally, a weak jobs report triggered the largest single-day drop in mortgage rates in nearly a year, fueling optimism for buyers and investors. Yet the same report raised concerns about broader economic stability and recession risk. Locally, Central Ohio continues to outperform national sentiment: while showings per listing have softened, overall demand remains healthy with raw showings up YoY, median prices climbing, and inventory expanding. Buyers are gaining leverage through increased supply, while sellers still benefit from a resilient job market and steady price growth.
Tailwinds:
Mortgage rates dropped sharply after the weak August jobs report, hitting levels not seen since Fall 2024.
Columbus remains resilient, with strong job growth, rising new listings, and healthy showing activity despite national challenges.
Headwinds:
Weak jobs report confirmed labor market softening, raising concerns about recession risk.
Inflation remains above the Fed’s target, limiting future rate cut flexibility.
National affordability remains at crisis levels, with buyers still cautious despite rate relief.
TL ; DR 📖
Macro:
⬇️ Jobs report shock: only +22K jobs in August, unemployment at 4.3%
⬇️ Mortgage rates plunged to 6.29%, the lowest in 11 months
⬇️ 10yr Treasury dropped to 4.10% on bond rally
Fed cut odds nearly certain Sept 17 (92% for -25 bps)
Central OH:
Closings flat YoY, median prices ⬆️ 6%
Active inventory ⬆️ 70% YoY, DOM ⬆️ 27%
Showings per listing ⬇️ 34% YoY, but raw showings ⬆️ 11.7%
Macro Update 📊
Stock Market Performance Last Week
Dow: ⬇️ -0.3% (45,400.86)
S&P 500: ⬆️ +0.3% (6,481.50)
Nasdaq: ⬆️ +1.1% (21,700.39)
Markets rallied early in the week but pulled back Friday on weak jobs data.
10 Yr Treasury Bond Performance
Sep 5: Ended the week at 4.10%
Weekly trend: Downward on “flight-to-safety” buying.
30-Yr Mortgage Rates (Mortgage News Daily)
Aug 29: 6.50%
Sep 2: 6.53%
Sep 3: 6.49%
Sep 4: 6.45%
Sep 5: 6.29%
Weekly Avg: 6.45%
As of 09/08, we’re sitting around 6.28%

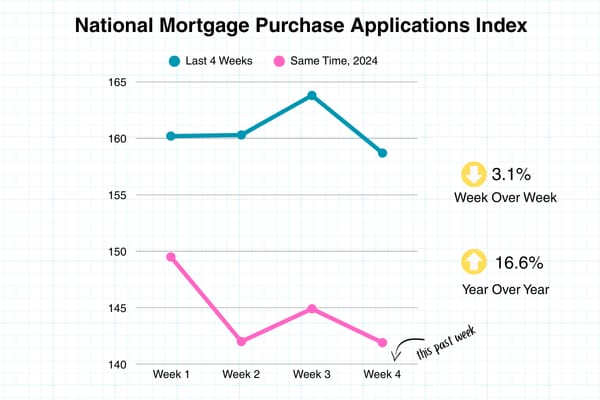
Mortgage Applications
National Mortgage purchase applications week over week are down 3.1%
National Mortgage purchase applications same week, year over year are up 16.6%
Last 4 weeks: 160.2 → 160.3 → 163.8 → 158.7
Same period 2024: 149.5 → 142.0 → 144.9 → 141.9

Other Indicators
Fear & Greed Index: 53 (Neutral)
shared.image.missing_image
Truflation Inflation Index: 2.02%
Sentiment on X (Last 7 Days) 📢
National:
The August jobs report disappointed, with just +22K jobs and upward unemployment pressure. Mortgage rates fell sharply, fueling optimism for affordability.
Stocks ended mixed as investors weighed recession concerns against Fed cut hopes.
Columbus:
Closings held steady YoY, while new listings surged +21.2%, boosting supply.
Median prices rose +6%, though showings per listing fell -34% YoY, indicating selective buyer activity.
Active inventory climbed +70% YoY, giving buyers more leverage.
Pull Quote:
“Weak jobs data triggered the biggest mortgage rate drop in nearly a year, but affordability challenges still define the market.”
Central Ohio Market Update 🌎📍
Market Dynamics: A Seller’s Market shifting toward Buyer-friendly conditions.
The Columbus market continues to show resilience even as affordability pressures remain. Median prices are up ⬆️ 6% YoY, while active inventory has surged ⬆️ 70% YoY. Showings per listing have dipped ⬇️ 34% YoY, but total raw showing counts are actually ⬆️ 11.7%, showing steady interest with more homes on the market.
Stats from the Last 4 Weeks (Aug 10–Sep 6, 2025)
Closings: 2,395 ⬆️ 0.0% YoY
New Listings: 2,889 ⬆️ 21.2% YoY
Active Inventory: 5,349 homes ⬆️ 70.0% YoY ⬆️ 0.3% WoW
Median Sales Price: $349,900 ⬆️ 6.0% YoY
Avg DOM: 28 ⬆️ 27.3% YoY
Months of Supply: 2.2
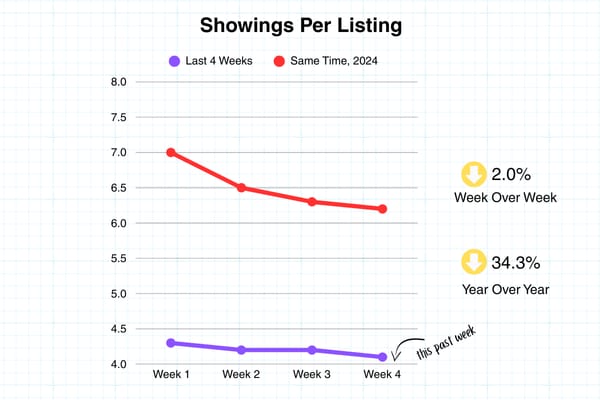
Showings per Listing: 4.1 ⬇️ 34.3% YoY ⬇️ 2.0% WoW
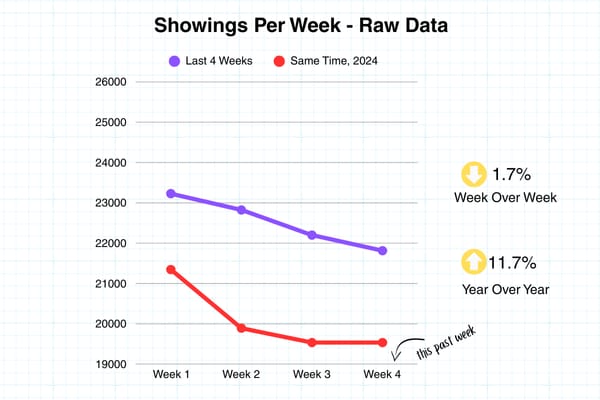
Raw Showings: 21,815 ⬆️ 11.7% YoY ⬇️ 1.7% WoW
YTD Snapshot
Closings: 19,337 ⬇️ 0.9% YoY
New Listings: 24,116 ⬆️ 13.7% YoY
Median Sales Price: $339,777 ⬆️ 4.1% YoY
Avg $/SF: $213.40 ⬆️ 3.1% YoY
LP/SP Ratio: 98.4% ⬇️ 0.3% YoY
Showings & Affordability
Question: Where would rates need to be for Franklin County to have an Affordability Index of 100? 🤔
Answer: Assuming a median home price of $340,000 & a median income of $71,680, mortgage rates would need to be at 5.20% to achieve an Affordability Index of 100 - ie, a family with the median income can afford the mortgage payment on a median-priced home. The average weekly Affordability Index for 2025 in Franklin Co. is 90.7. As of June 2025, the National Affordability Index is 94.4 (Source: National Association of Realtors via FRED®).
Affordability Index – Franklin County
Last 4 Weeks: 86.7 → 90.2 → 84.9 → 90.0
Same Period 2024: 86.5 → 95.6 → 91.2 → 97.3

Showings per Listing –
Last 4 Weeks: 4.3 → 4.2 → 4.2 → 4.1
Same Period 2024: 7.0 → 6.5 → 6.3 → 6.2
Showings per Listing WoW: ⬇️ 2.0%
Showings per Listing YoY: ⬇️ 34.3%

Raw Total Showings –
Last 4 Weeks: 23,229 → 22,825 → 22,200 → 21,815
Same Period 2024: 21,346 → 19,891 → 19,535 → 19,535
Raw Showings WoW: ⬇️ 1.7%
Raw Showings YoY: ⬆️ 11.7%


Here’s the data:
Open to All Central Ohio Agents: Real Estate Rendezvous📣🎟️
Join us September 24th for the next Real Estate Rendezvous! This month’s event features a panel of agents licensed for less than five years who are already achieving strong results. They’ll share their journey so far, along with practical tips and strategies you can apply to grow your own business. See you there!
All data pulled from Columbus REALTORS® Multiple Listing Service (MLS). Central OH is defined as Single-Family, Residential listings from the following Counties - Franklin, Delaware, Licking, Fairfield, Union, Pickaway, Madison, Morrow, Fayette, Athens, Champaign, Clark, Clinton, Hocking, Knox, Logan, Marion, Muskingum, Perry, Ross. Sales figures do not account for seller concessions/credits provided to buyers. Price reductions are defined as a reduction taken at any time during the lifespan of the listing.


