Happy Tuesday!

🔥 Hot Off the Press | Fresh CPI Data released 08/12 🔥
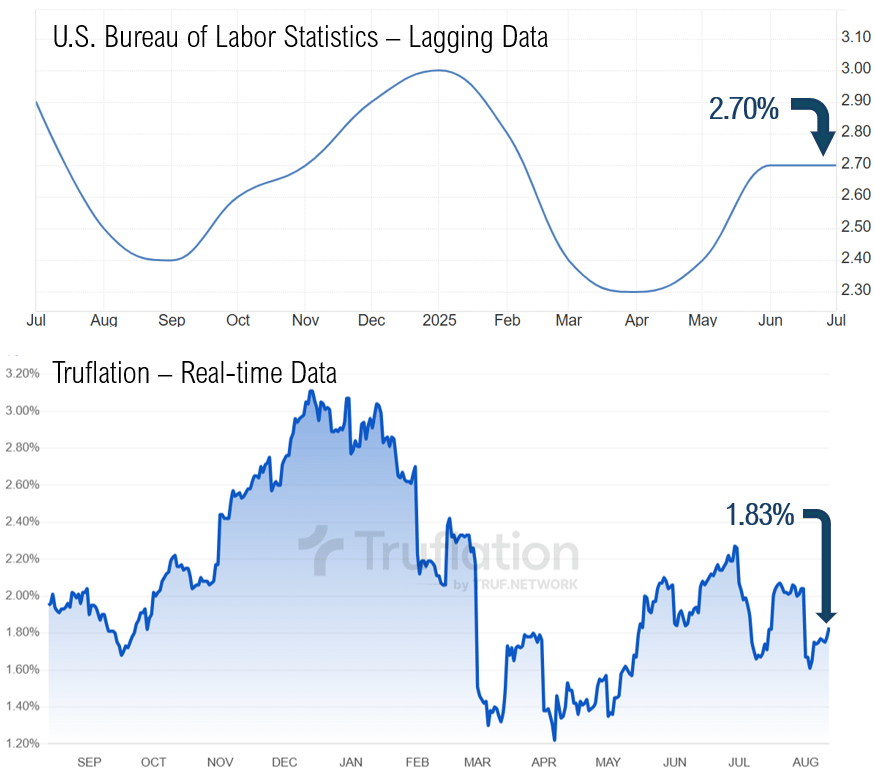
This morning’s July CPI came in slightly cooler than expected, boosting market odds of a September Fed rate cut from 86% yesterday to 94.4% today.
Headline CPI: ⬆️ 0.2% MoM, ⬆️ 2.7% YoY (vs. 2.8% forecast)
Measures overall inflation, including all categories like food and energy, which can be more volatile.
Core CPI: ⬆️ 0.3% MoM, ⬆️ 3.1% YoY (in line with forecast)
Excludes food and energy prices to provide a clearer view of underlying, longer-term inflation trends.
High-Level Insights ✈️
The US housing market saw a small but welcome dip in mortgage rates, offering some relief to buyers, though affordability remains a key headwind. Inventory is rising in several states, particularly in the South and West, creating pockets of price softening. In Central Ohio, supply is at its highest level in years, days on market is lengthening, and buyer activity is below last year’s pace. Sellers still hold leverage in many areas, but growing inventory and higher months of supply are shifting the balance toward buyers, especially for listings not priced competitively.
Tailwinds: Slightly lower mortgage rates, increased inventory giving buyers more options, and a likely Fed rate cut in September.
Headwinds: Affordability constraints, slower pace of sales, and uncertainty around future economic conditions and policy changes.
TL ; DR 📖
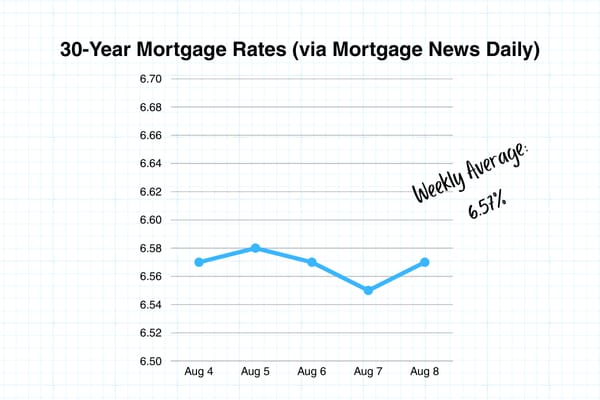
Mortgage rates ticked down, with the 30-year fixed averaging 6.57% last week.
Inventory gains are softening prices in parts of the US; Central Ohio active listings up 71.7% YoY.
Showings per Listing in Central Ohio is down nearly 30% from last year.
The Fed is widely expected to cut rates in September, with potential for an additional cut in October.
Last Week’s Headline Roundup 📰
Mortgage rates fell to 10-month lows, attributed to a weaker jobs report.
Home prices saw modest declines in some Southern and Western regions.
Inventory is now above pre-pandemic levels in 12 states.
June existing home sales fell 2.7% (NAR) while housing starts rebounded 4.6% on multifamily strength.
Speculation of Fed rate cuts later this year could ease mortgage rates further.
White House considering a public offering of Fannie Mae/Freddie Mac stock and elimination of capital gains tax on home sales.
Macro Update 📊
Trump Eyes $30B Fannie/Freddie IPO as Path Out of Conservatorship:
Last week, reports surfaced that the Trump administration is weighing an IPO of Fannie Mae and Freddie Mac that could raise roughly $30 billion by selling 5–15% of the companies’ stock, valuing the pair at over $500 billion. The move would mark a major step toward ending their 17-year federal conservatorship, though questions remain about whether they would go public separately or together, and if government control would persist. While President Trump is pushing the idea and consulting with Wall Street leaders, analysts see the proposed timeline, by year-end 2025, as highly ambitious.
Key Points:
Potential IPO could raise ~$30B, selling 5–15% of stock.
Combined valuation estimated at $500B+.
Decision pending on separate vs. merged offering.
Would be a major step toward ending conservatorship since 2008 crisis.
Bill Ackman (high-profile hedge fund manager) supports a merger, citing lower mortgage rates and significant operational benefits.
Analysts call the 2025 timeline “extraordinarily aggressive.”
Stock Market Performance Last Week:
DOW Jones: ⬆️ 1.4% – Ending the week at 44,175.61.
S&P 500: ⬆️ 2.4% – Closed the week at 6,389.45, just shy of record high.
Nasdaq: ⬆️ 3.9% – Record high close at 21,450.02, boosted by tech and Apple’s surge.
Mortgage Rates Last Week:
Mortgage Purchase Applications:
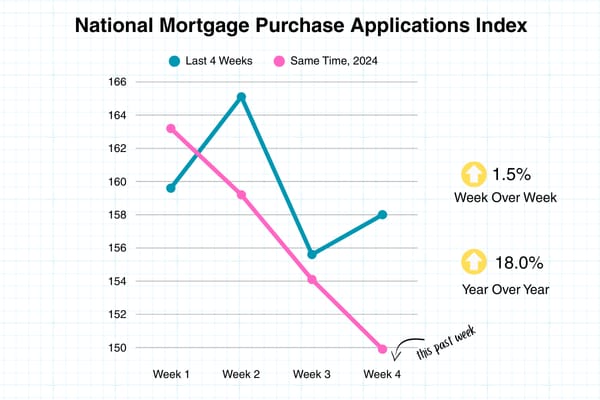
National Mortgage purchase applications week over week are up 1.5% National Mortgage purchase applications same week, year over year are up 18%
Federal Reserve (CME FedWatch):
Next FOMC Meeting (Sept 17, 2025):
Chance of 25bps cut: 94.4%
No change: 5.6%
October 29, 2025 Meeting Odds:
Additional 25bps cut: 60.5%
No change (assuming a Sept cut): 37.5%
Other Indicators:
Fear & Greed Index: 58 (Greed)
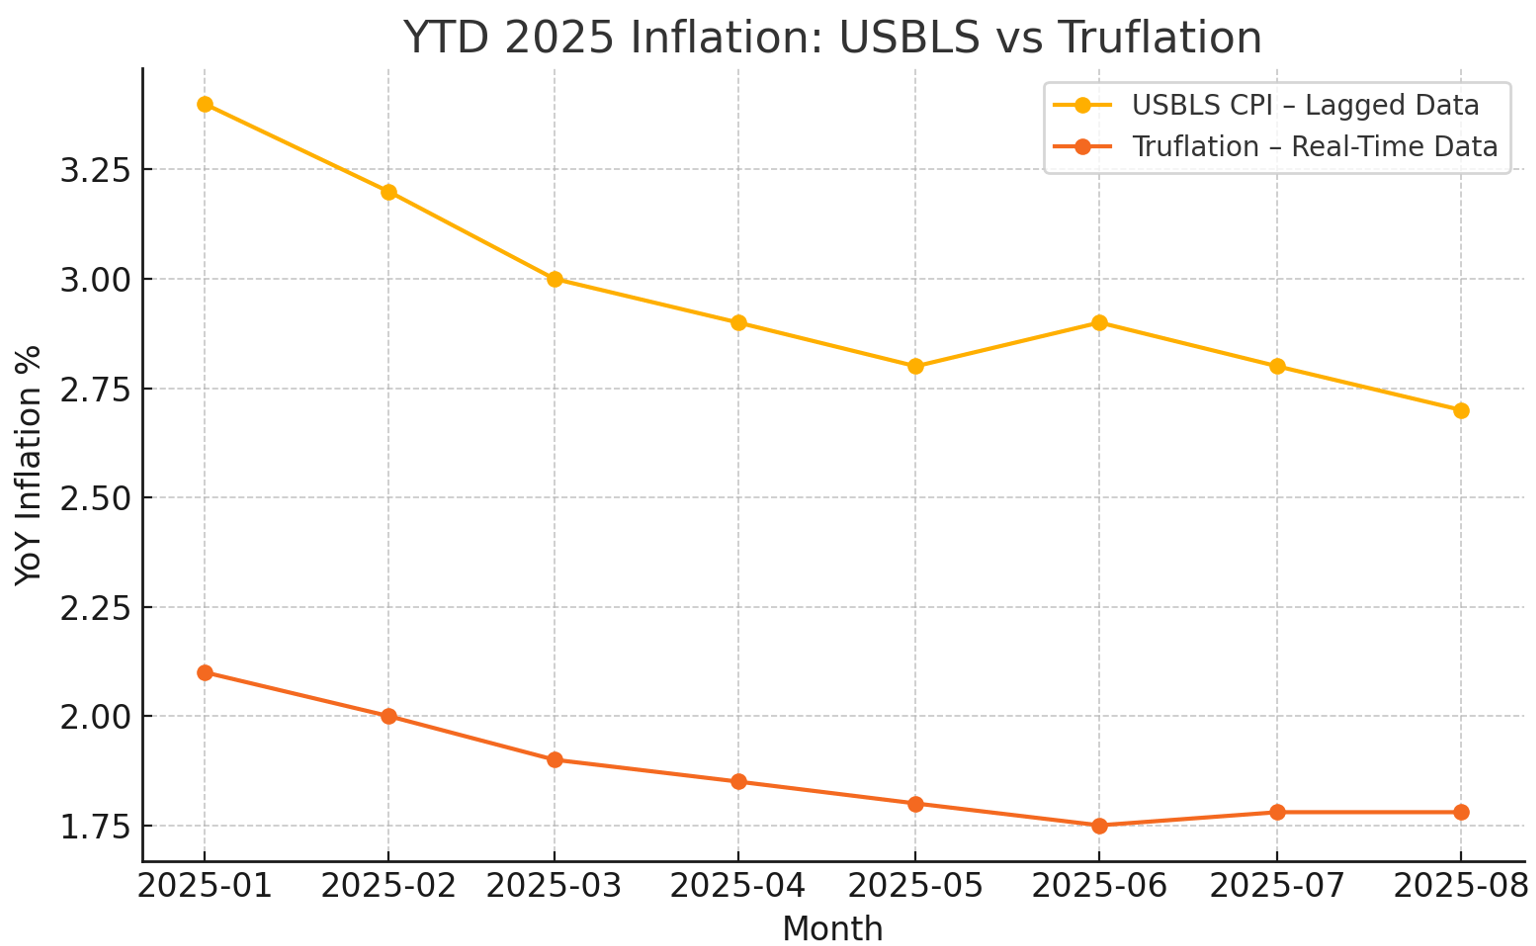
Truflation US Inflation Index: 1.83%
Sentiment on X (Last 7 Days) 📢
National Residential Mood:
Still viewed as a seller’s market, but expectations are shifting toward buyers in the future due to demographic changes and possible rate cuts.
Affordability remains the main frustration.
Columbus/Central Ohio Residential Mood:
Little direct housing conversation; no negative market sentiment detected.
Central Ohio Market Update 🌎📍
Stats from the Last 4 Weeks (July week 3 - Aug Week 1, 07/13 - 08/09):
Closings: 2,447 ⬇️ 2.3% YoY
New Listings: 3,238 ⬆️ 26.5% YoY
Active Inventory: 5,217 ⬆️ 71.7% YoY | ⬇️ 0.2% WoW
Median Sale Price: $345,000 ⬆️ 3.0% YoY
Average Days on Market (DOM): 28 days ⬆️ 33.3% YoY
Months of Supply: 2.1
Active Listings with Price Reductions: 58.1%
Average Price Reduction from Original List: 6.4%
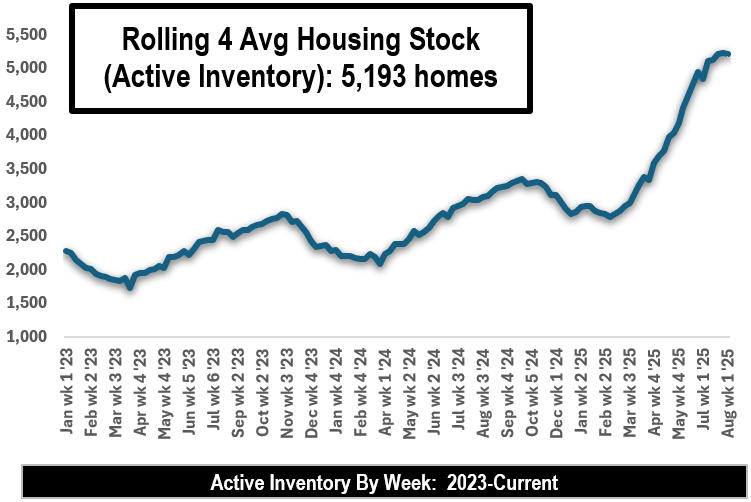
Central Ohio Average Active Inventory, January 2023 - Present
YTD Snapshot (through August Week 1):
YTD Closings: 16,846 ⬇️ 1.6% YoY
YTD Median Price: $337,250 ⬆️ 3.8% YoY
YTD Avg $/SqFt: $212.99 ⬆️ 2.9% YoY
YTD LP/SP Ratio: 98.5% ⬇️ 0.2% YoY
YTD New Listings: 21,609 ⬆️ 14.7% YoY
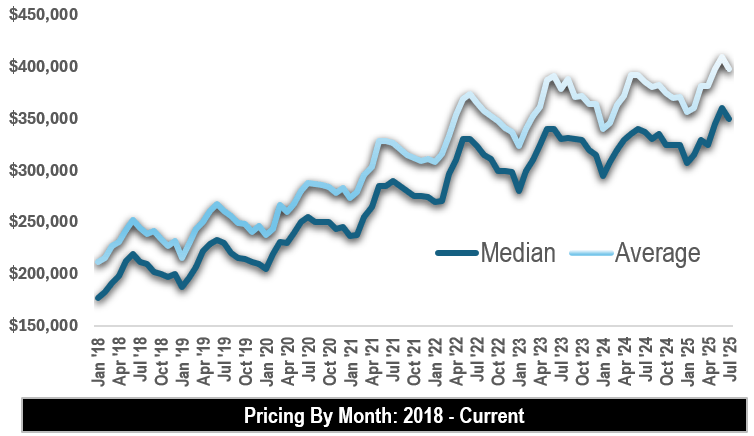
Central Ohio Average & Median Sales Prices by Month
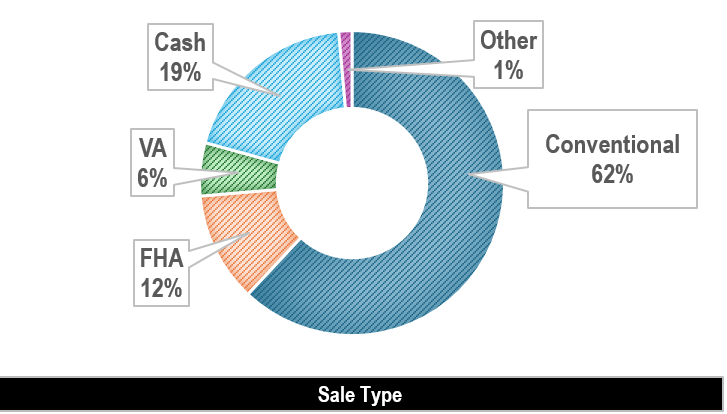
Central Ohio Sale Type: 2025 YTD
Affordability & Buyer Activity:
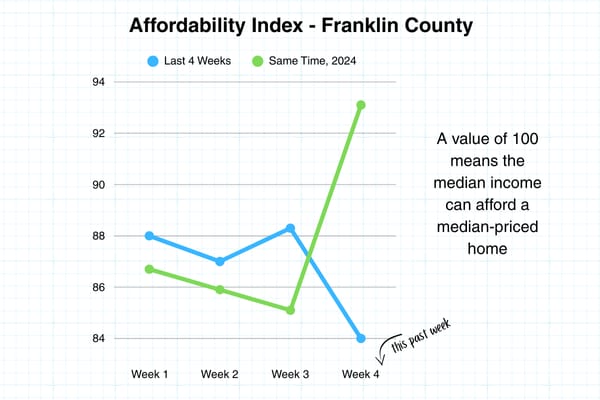
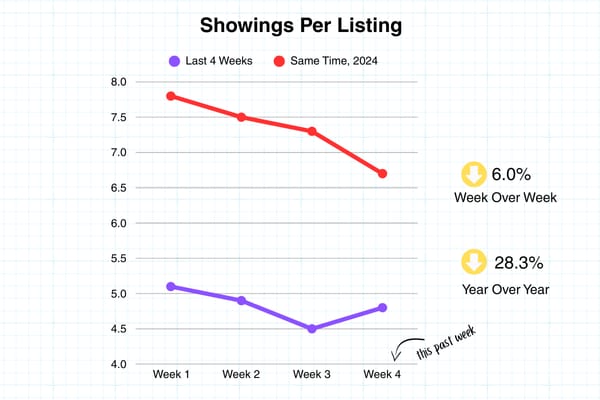
Historical Trends:
By the end of August, we've historically completed 67% of yearly sales. August is typically the strongest month in sales & 5th in new listings.
Here’s the data:
